Metrics
Metrics is all about answering questions about how your team is using Tagify.
- How much are we spending?
- Who's making the most projects?
- What's our turnaround in Activity?
- How much in bill-backs can we send to a certain supplier?
From costs to usage to accountability, you can get the data you need.
Metrics is focused on brand/supplier/user cost and usage. There are things that Tagify does to the PDF's themselves that aren't reflected in the costs (sign autofill, etc). So if you're focusing on material costs, you may see some discrepancies.
Long story short: don't fire anyone based on data you get from Metrics because it cannot be perfect.
You may want to add some tag or sign costs in your Metric company settings if you haven't already.
Click on Tools then Metrics.
Metrics is split into 2 sections.
Dashboard
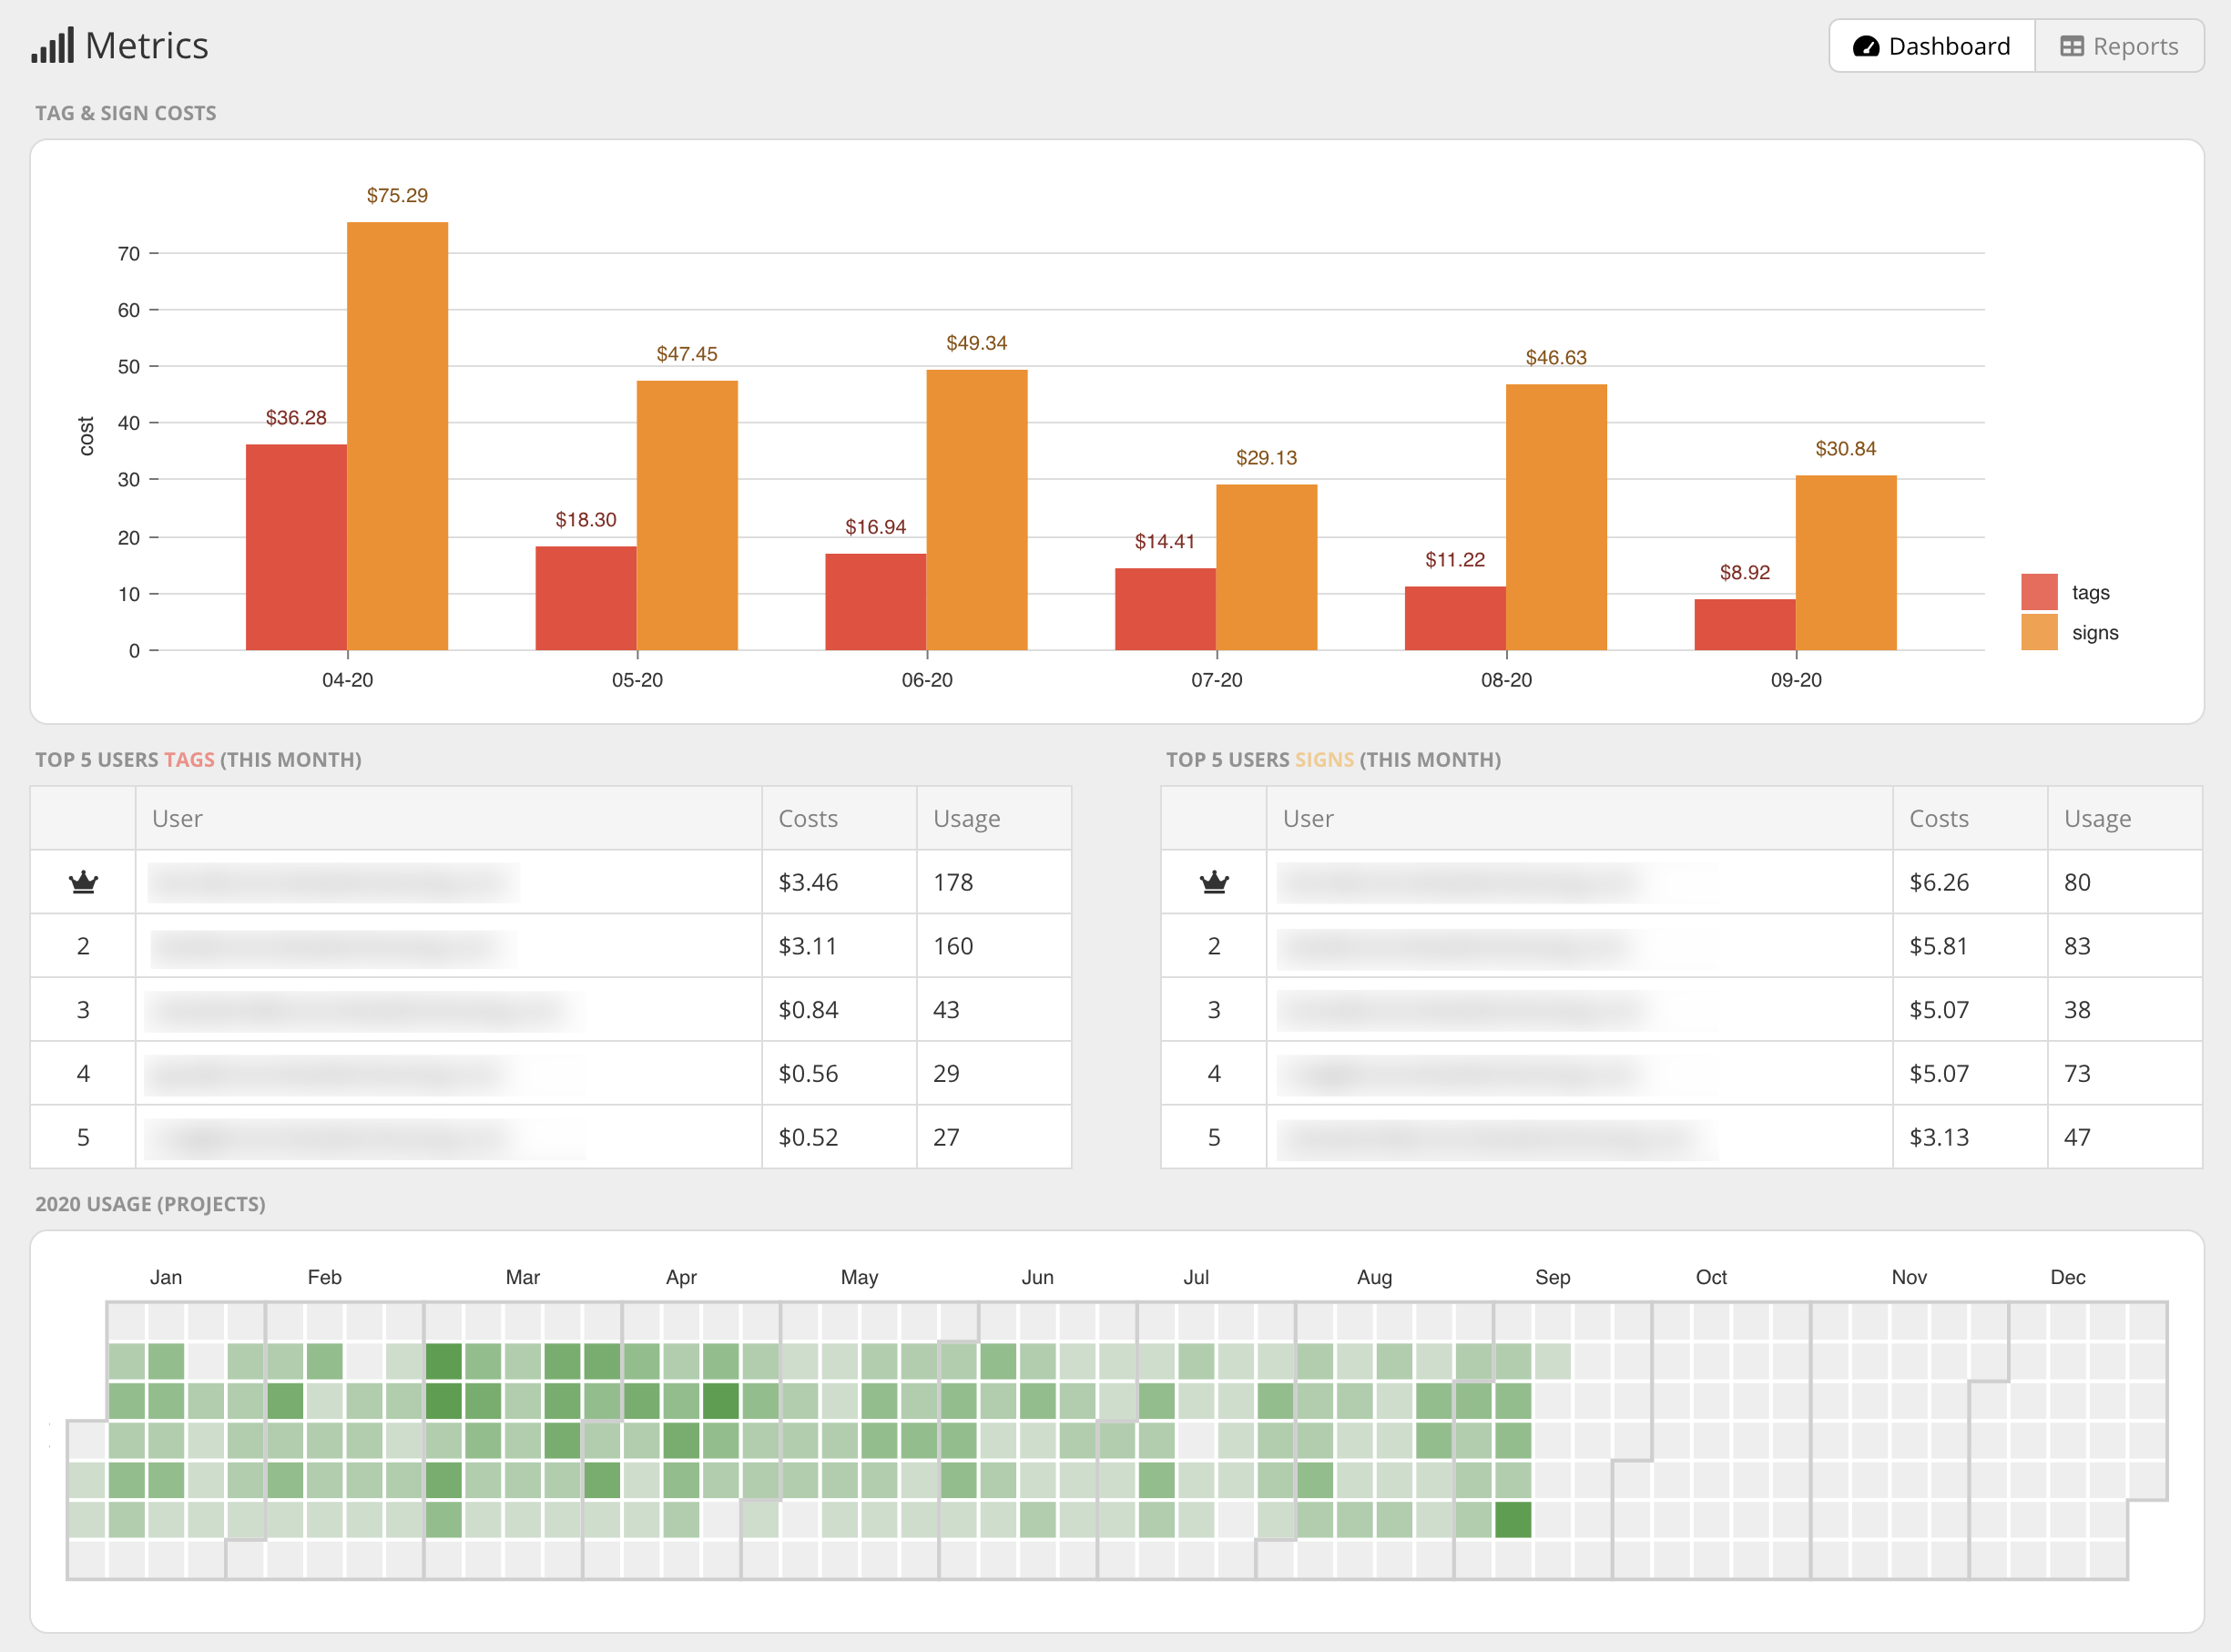
Dashboard gives you quick, visual pieces of data you can make decisions on. Should that user really be top in sign costs this month? What suppliers are in my top 5? My on-premise folks are killing me this month!
Here's some at-a-glance info you've got in Dashboard:
- Tag & sign costs
- Top 5 users for tag projects
- Top 5 users for sign projects
- Year to date usage
- Costs by user labels
- Top 5 brands
- Top 5 suppliers
This data is calculated nightly as well as automatically while viewing the dashboard for a certain duration of time. I've seen a bunch of sign shops that have big monitors/TV's that the entire team can see. Dashboard would be a perfect split screen with Activity!
Reports
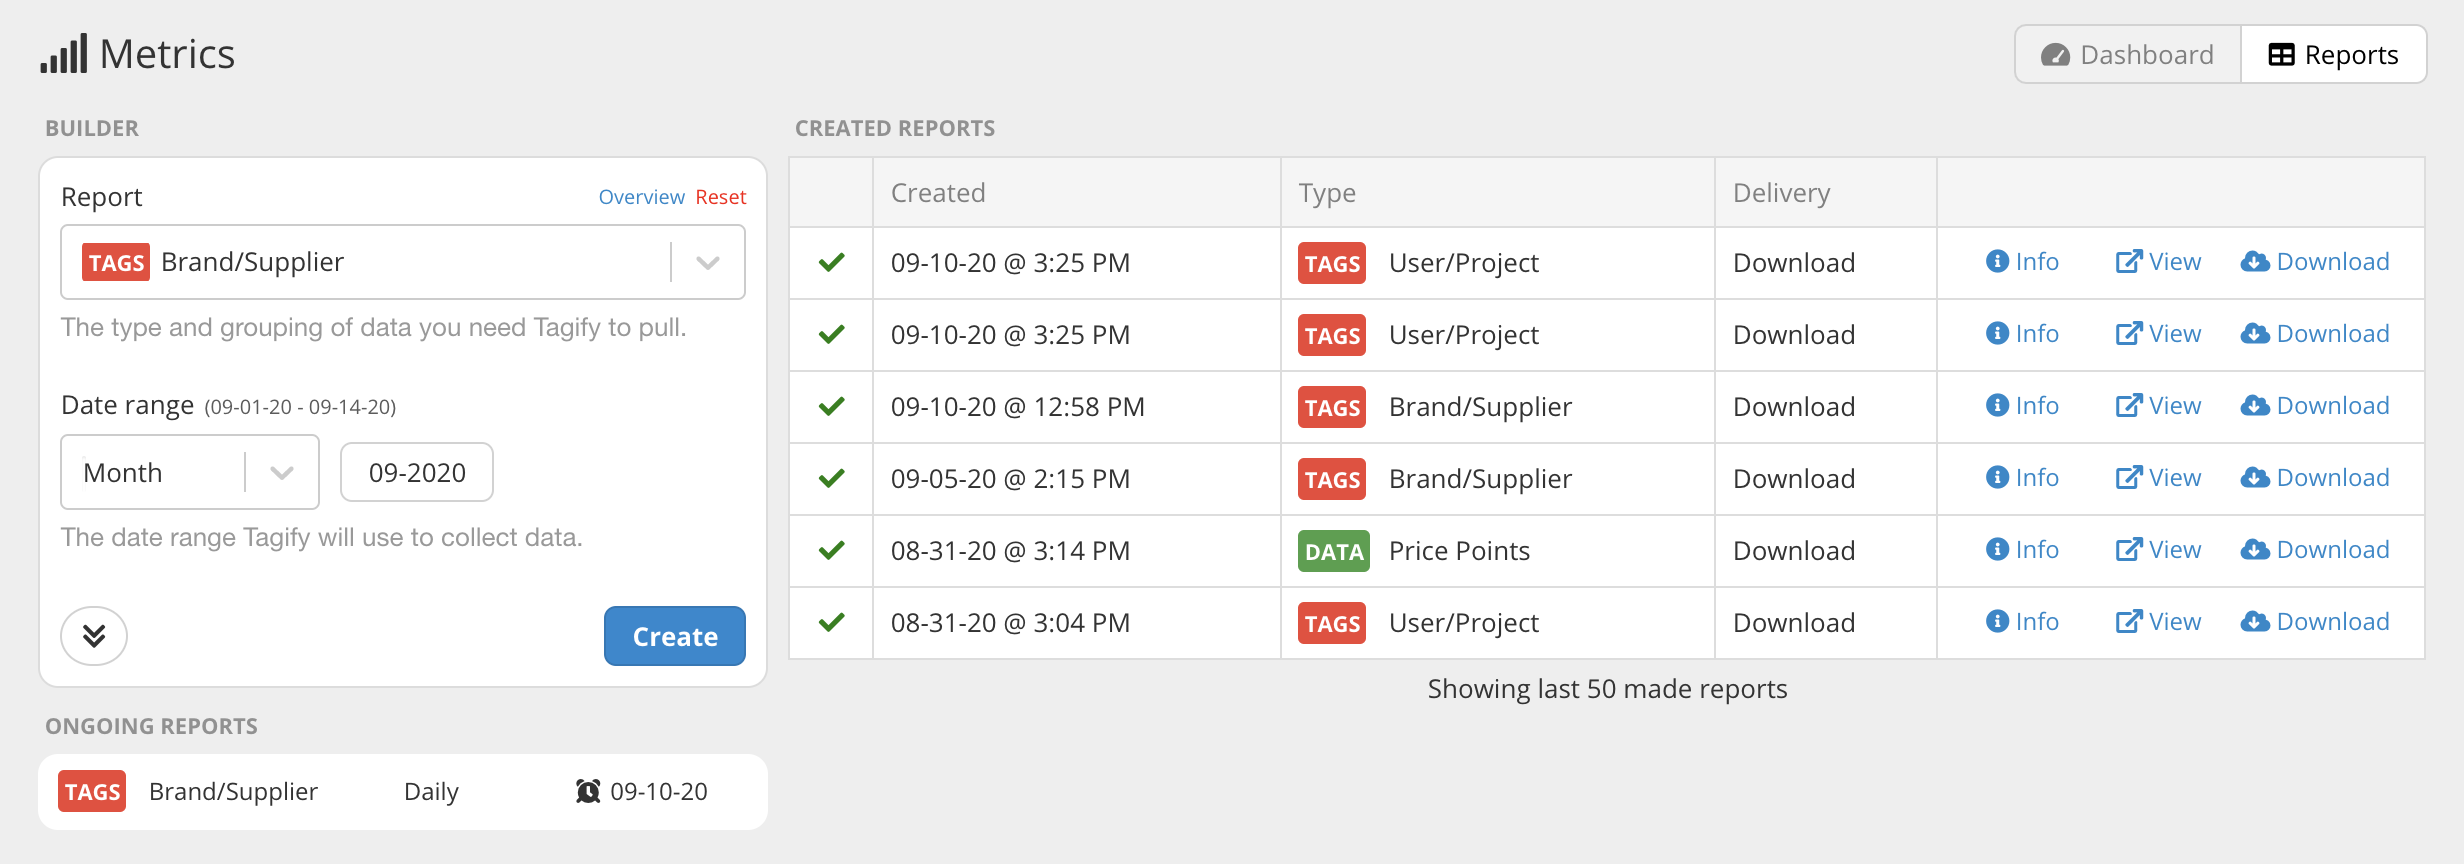
While Dashboard is perfect for getting a general idea of what's going on, at some point you're going to need to specifics. Reports lets you do just that with just a couple clicks.
Builder
On the left side, you'll see the Builder section. This is where you pick the type of report and the date range. Click Create and Tagify does the rest. Let's take a closer look:
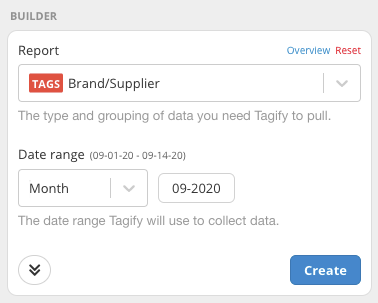
Hit the Report drop down and you'll see reports sectioned out by Tags, Signs and Data. Not sure which one to pick? Click Overview up top and you'll get a nice window giving you a breakdown of what columns each report contains.
Next, the Date range section is just that. You can easily grab the current month, last month, this year, last quarter, etc. No need to manually punch in dates! Although if you do get the itch for a weird date range, just use the Custom option.
We can get even crazier by hitting the double arrow button to show even more options:
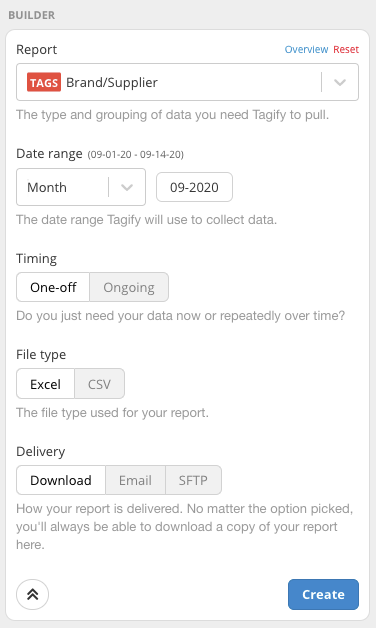
We can now see 3 new options:
Timing: Most reports you make you'll need on the spot (One-off) but we can also setup Ongoing reports here as well. You'll be able to use the Timing option to tell Tagify how often you want the report ran.
File type: Do you need this in XLSX or CSV? The latter would be useful for Ongoing reports that get sent to your internal data processing tools.
Delivery: While you'll always be able to download your created reports (next section) here, you can also have them emailed directly to someone or even uploaded to your local SFTP server. Pretty cool!
We've clicked buttons and selected drop downs, let's hit Create to actually make your report. You'll see Tagify immediately get to work over in the Created Reports section:
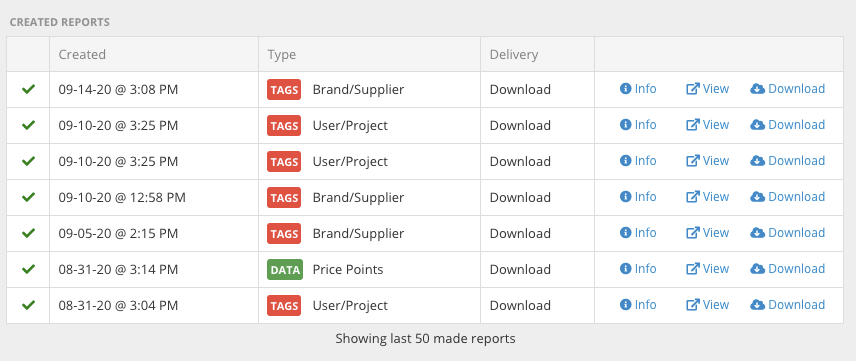
From here, we can download, view and get details on our new report. You'll notice that Tagify keeps track of all of the reports we've ran. We can even queue up a bunch of reports at once and just come back here when they're finished.
Clicking Info on the created report gives you details as well:
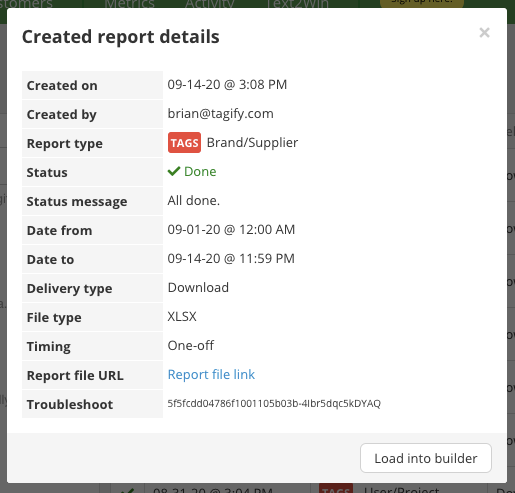
We can even hit that "Load into builder" button to put the details for this report back into Builder. So if you wanted to re-run an old report but forgot the setup, it's easy to re-create it.